

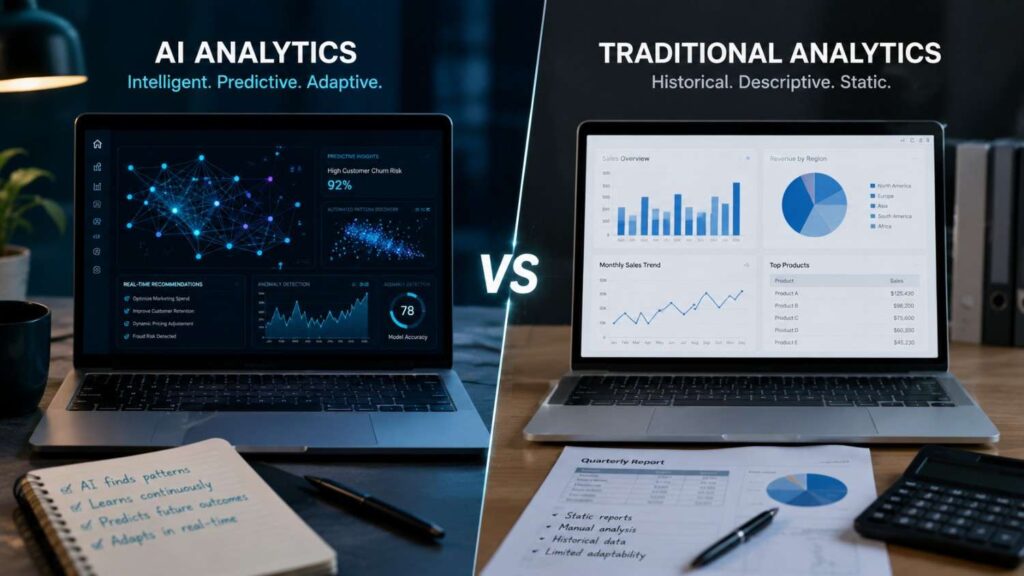
AI Analytics vs. Traditional Analytics: Key Differences for Modern Businesses
Understanding AI Analytics vs. Traditional Analytics: Key Differences helps organisations choose analytical methods that match their business questions, available data, internal capabilities, risk tolerance, and decision-making needs.
Traditional analytics normally begins with a known question. An analyst selects the relevant data, applies filters, calculations, or statistical techniques, and presents the result through a spreadsheet, dashboard, report, or visualisation. This approach is effective when the metrics, relationships, and reporting requirements are clearly defined.
AI analytics expands this workflow by using machine learning, natural-language processing, anomaly detection, and generative AI. These capabilities can help organisations predict future outcomes, recognise patterns, classify unstructured content, automate routine analysis, and provide conversational access to governed data.
The difference is not simply “old reporting versus intelligent technology.” Traditional analytics may use advanced statistics, and AI systems still rely on established data-management practices. Both approaches depend on trustworthy data, meaningful definitions, and a clear understanding of the decision being supported.
The four commonly discussed analytical categories are descriptive, diagnostic, predictive, and prescriptive analytics. Descriptive analytics explains what happened. Diagnostic analytics investigates why it happened. Predictive analytics estimates what may happen next. Prescriptive analytics recommends possible actions.
One thing I always check first is whether the organisation needs a trusted historical explanation, a forecast, a recommendation, or an automated action. Each outcome requires different methods, controls, and levels of human oversight.
For most organisations, the strongest strategy combines both approaches. Traditional analytics establishes a stable view of business performance, while AI supports prediction, automation, and exploration where those capabilities deliver measurable value.
How Traditional Analytics Works
Traditional analytics is generally question-driven and analyst-led. A stakeholder identifies a business problem or reporting requirement, and an analyst determines which data, calculations, filters, and visualisations are needed to answer it. The process is usually explicit and repeatable.
The output often takes the form of a spreadsheet, scheduled report, dashboard, chart, statistical analysis, or management presentation. These artefacts make business performance visible and allow teams to monitor agreed indicators over time.
Traditional analytics commonly relies on structured data stored in databases, data warehouses, spreadsheets, or enterprise applications. Before analysis begins, teams define fields, relationships, calculations, business rules, and key performance indicators. These definitions form the analytical foundation used across departments.
This structure is a major strength. When teams use the same definition of revenue, active customer, fulfilled order, or operating margin, reports become easier to compare and audit. Stakeholders can trace a number back to its source and understand how it was calculated.
However, conventional workflows may require substantial manual effort. Analysts often clean data, write queries, configure reports, investigate anomalies, and answer follow-up questions individually. This can slow decision-making when demand for analysis increases.
Traditional analytics should not be equated with simplistic reporting. It can include advanced statistics, forecasting, optimisation, segmentation, and experimentation. The defining feature is that people usually specify the analytical process more directly and retain greater control over assumptions, calculations, and outputs.
Reporting, Descriptive Analytics, and Diagnosis
Descriptive analytics summarises historical or current information to explain what happened. Common examples include monthly sales, website traffic, production output, customer-service volumes, operating expenses, employee turnover, and conversion rates.
Diagnostic analytics takes the next step by investigating why a result occurred. An analyst may compare regions, customer groups, products, campaigns, channels, or time periods to identify factors associated with a change. For example, a decline in total revenue might be traced to one product category, market, or customer segment.
Reports and dashboards are valuable because they make recurring metrics visible. Managers can review performance consistently without rebuilding the same analysis for every meeting. Alerts and conditional formatting may also highlight values that require attention.
Traditional diagnosis still requires business judgement. A dashboard can show that two variables changed together, but it cannot automatically prove that one caused the other. Analysts must consider market conditions, process changes, operational events, and other contextual factors.
The most dependable reporting environments use governed definitions, documented calculations, reliable data sources, and data-quality checks. These controls allow users to reproduce results and explain where the figures came from.
This transparency is one reason traditional reporting remains essential even when organisations add machine learning, predictive modelling, or generative analytics capabilities.
Strengths and Limitations of Traditional Methods
The main strengths of traditional analytics are transparency, consistency, reproducibility, and direct control. Analysts define the question, select the source data, apply a documented calculation, and present the result in a form that stakeholders can review.
These qualities make conventional reporting suitable for recurring operational, financial, regulatory, and compliance-related decisions. Users can inspect the logic behind a metric and determine whether it matches agreed business definitions.
Traditional analytics can also be economical when the requirement is stable. A well-designed dashboard may answer the same set of business questions for years without requiring model training, inference, retraining, or continuous AI monitoring.
Its limitations become more visible as data volume, variety, and decision speed increase. Analysts may struggle to review every relationship manually or respond individually to thousands of requests. Long development queues can also delay access to useful information.
Structured reports may miss insights contained in contracts, support conversations, images, recordings, emails, and free-form text. These data sources often need to be transformed or coded before conventional tools can analyse them effectively.
Traditional methods are strongest when the question, metric, and workflow are known. They become less efficient when the organisation needs automated pattern discovery, large-scale classification, adaptive prediction, or analysis across rapidly changing and unstructured datasets.
How AI Analytics Changes Data Analysis
AI analytics changes data analysis by allowing systems to learn patterns, estimate outcomes, classify information, identify anomalies, and assist users through natural-language interfaces. Instead of requiring analysts to define every relationship manually, selected parts of the analytical process can be learned from historical examples.
A predictive model might estimate demand, customer churn, fraud risk, equipment failure, delivery delays, or the probability that a lead will convert. Other models may classify documents, prioritise cases, or identify observations that differ significantly from normal behaviour.
AI can also assist with data preparation and exploration. It may suggest visualisations, generate SQL, explain a trend, summarise a dashboard, or identify variables associated with an unusual result. These features can reduce the time between a business question and an initial analytical response.
Modern platforms increasingly integrate AI into existing analytics environments. Copilot in Power BI provides natural-language assistance for report consumers and creators, while BigQuery combines cloud analytics with machine learning and generative capabilities.
These features can improve accessibility, but they do not remove the need for trusted data, documented metrics, or skilled analysts. A system can produce a fast and confident answer while still misunderstanding the business question.
AI analytics therefore changes both technology and workflow. Teams need to validate models, monitor performance, manage permissions, review generated outputs, and determine when automated recommendations are appropriate.
The strongest implementations connect AI capabilities to governed data, clear business decisions, and measurable operational outcomes rather than treating AI as an isolated feature.
Prediction, Pattern Recognition, and Automation
Machine learning analytics identifies relationships in historical data and applies them to new observations. Depending on the task, the output may be a numerical forecast, category, probability, recommendation, or anomaly score.
A traditional report may show that customer cancellations increased during the previous quarter. A predictive model attempts to estimate which current customers are more likely to cancel in the future. That distinction allows organisations to move from retrospective understanding toward proactive decision support.
AI can also automate repetitive analytical work. A model might review transactions continuously, classify incoming support cases, prioritise sales opportunities, or alert an operations team when behaviour differs from an expected pattern.
Automation should be matched to the consequence of the decision. A model that prioritises cases for human review can operate with a different confidence threshold from a model that automatically blocks a customer transaction or changes an account.
Predictions also need an operational destination. A churn score has limited value if no team is responsible for deciding how to respond. The workflow should specify which action the insight supports, who owns that action, and how incorrect predictions will be handled.
The most successful applications normally begin with a measurable business decision rather than a broad goal to “use AI.” Teams should define the outcome, establish a baseline, and determine whether machine learning produces a meaningful improvement.
Natural Language and Unstructured Data
Natural-language analytics allows users to ask questions without manually writing every query. A business user might request a regional sales comparison, ask why a metric changed, or generate a summary of a dashboard through a conversational interface.
This can make analytics more accessible, but the quality of the answer still depends on the underlying data model, business terminology, permissions, and user question. A poorly designed semantic model can cause the system to interpret terms such as “customer,” “revenue,” or “active account” inconsistently.
AI also expands the types of information that organisations can analyse. Text, documents, images, audio recordings, emails, support tickets, product reviews, and other unstructured formats can be classified, summarised, extracted, or compared.
Typical use cases include sentiment classification, document extraction, image captioning, transcription, topic identification, and summarisation. These techniques can reveal information hidden in contracts, reports, customer conversations, and operational notes.
However, unstructured data is often ambiguous. Tone, context, incomplete documents, and inconsistent terminology can produce unreliable classifications or summaries.
Generated interpretations should therefore be validated, especially when they influence important decisions. Organisations also need appropriate privacy, access, retention, and security controls because unstructured content may contain sensitive or personally identifiable information.
Natural-language interfaces can improve access, but they should complement governed analytics rather than bypass established definitions and controls.
AI Analytics vs. Traditional Analytics: Key Differences
The most important differences between traditional and AI analytics involve how questions are defined, which data can be processed, how outputs are produced, and how much uncertainty the organisation must manage.
Traditional analytics usually follows an explicit process designed by an analyst. The analyst specifies the calculation, query, filter, model, or visualisation. This gives the organisation greater control over the analytical pathway and makes results easier to reproduce.
AI analytics can learn or automate parts of that process. A model may discover relationships, classify new records, estimate future outcomes, or recommend an action. These outputs can be highly valuable, but they are often probabilistic rather than guaranteed.
The methods also differ in the types of data they can handle efficiently. Traditional business intelligence is strongest with organised tables and documented metrics. AI can extend analysis to free-form text, images, audio, and other unstructured or multimodal information.
Skills and governance requirements differ as well. Traditional analytics relies heavily on SQL, statistics, visualisation, and business knowledge. AI analytics adds model evaluation, prompt design, data-science expertise, model monitoring, explainability, and responsible-use controls.
The comparison table below summarises the principal differences. It should not be treated as a universal decision rule because many modern platforms combine both approaches within one environment.
For readers looking for a broader perspective, business intelligence comparison explains how AI capabilities complement traditional BI practices rather than replace them.
| Area | Traditional Analytics | AI Analytics |
|---|---|---|
| Primary focus | Reporting and explanation | Prediction, automation, and recommendation |
| Typical questions | What happened and why? | What may happen and what should we do? |
| Main methods | Queries, dashboards, rules, statistics | Machine learning, NLP, and generative AI |
| Data types | Mainly structured data | Structured, text, image, audio, and multimodal data |
| Workflow | Analyst defines most steps | Models automate or recommend some steps |
| Output | Reports, charts, KPIs, and findings | Predictions, classifications, summaries, and recommendations |
| Explainability | Usually more direct | Varies by model and application |
| Adaptation | Reports change through manual development | Models may require retraining or recalibration |
| Skills | SQL, statistics, BI, and business knowledge | Traditional skills plus ML, AI governance, and monitoring |
| Main risk | Slow or limited analysis | Bias, incorrect predictions, opacity, and model drift |
Speed, Scale, and Analytical Flexibility
Traditional analysis may require an analyst to write a query, inspect the data, validate the result, create a visualisation, and explain the findings. This process supports quality control, but it can become a bottleneck when the organisation receives more analytical requests than the team can handle.
AI-assisted analytics can accelerate selected parts of the workflow. It may generate queries, suggest charts, summarise trends, identify unusual behaviour, or help users explore governed data through natural language.
AI systems can also apply the same analytical process across very large datasets. This is useful for anomaly detection, document classification, recommendation, forecasting, and other tasks that would be impractical to perform manually at scale.
However, speed should not be confused with reliability. A conversational interface may produce an answer quickly, but the result still depends on the data model, the wording of the question, and the validity of the generated analysis.
Traditional systems may remain more efficient for stable, recurring reports. There is little value in replacing a trusted KPI calculation with a probabilistic workflow merely because AI is available.
Analytical flexibility is most useful when questions vary, data changes frequently, or human review cannot scale. The best approach balances speed and adaptability with validation, governance, and the business consequences of an incorrect result.
Skills, Workflow, and Decision Support
Traditional analytics teams commonly rely on SQL, spreadsheet modelling, statistics, data visualisation, and business-domain knowledge. These skills remain essential because AI systems still need reliable datasets, meaningful metrics, and informed interpretation.
AI analytics adds requirements such as feature preparation, model selection, validation, prompt design, model monitoring, security, and risk management. Even when a platform makes AI accessible through natural language, specialists are needed to build and govern the underlying environment.
The role of the analyst therefore changes rather than disappears. Analysts may spend less time answering repetitive questions and more time validating results, defining business terms, interpreting uncertainty, and connecting insights to decisions.
AI can also move analytics closer to operational systems. A prediction may trigger an alert, recommendation, prioritisation rule, or automated workflow instead of remaining inside a dashboard.
This increases the importance of ownership and accountability. Teams should document who owns the model, who reviews errors, and which actions may occur automatically.
Traditional analytics primarily informs people. AI analytics may inform people, recommend actions, or influence systems directly. The closer the output moves toward automated action, the stronger the need for testing, monitoring, approval rules, explainability, and fallback procedures.
Organisations should develop technical and business skills together rather than treating AI analytics as a purely data-science initiative.
Data Quality, Explainability, and Governance
Both traditional and AI analytics depend on reliable data, but AI systems can amplify underlying weaknesses because models learn relationships from historical examples and apply those relationships to new observations.
Missing records, duplicate entities, inconsistent labels, outdated fields, unrepresentative samples, and incorrect definitions can all reduce analytical quality. A polished dashboard or fluent natural-language explanation does not prove that the underlying information is suitable.
Traditional reporting can also contain errors, but the calculation path is often easier to inspect. A user may be able to review the source table, query, formula, and filter directly. Machine learning and generative systems may involve relationships that are more difficult to explain.
Governance must therefore cover more than data access. It should address source selection, metric definitions, model objectives, permissions, intended use, validation, limitations, monitoring, and accountability.
The NIST AI Risk Management Framework provides voluntary guidance for governing, mapping, measuring, and managing AI-related risks. Its principles can help organisations structure responsibilities and evaluate whether AI systems are reliable and appropriate for their intended context.
Governance should be proportionate to consequence. A model that recommends dashboard colours does not require the same level of oversight as one that influences credit, healthcare, employment, insurance, or access decisions.
A practical programme combines technical controls with clear ownership. Teams should know who approves the data, who validates the model, who monitors performance, and how users can question or report an incorrect output.
Responsible AI analytics begins with a trusted data foundation and continues through the full operational lifecycle.
Why AI Does Not Fix Poor Data
AI cannot reliably compensate for data that is incomplete, inconsistent, outdated, inaccessible, or poorly defined. It may instead produce a confident output based on patterns that do not accurately represent the business process.
For example, a customer-churn model trained only on survey respondents may not represent customers who never completed the survey. A natural-language analytics system connected to conflicting metric definitions may return different answers depending on which dataset or semantic model it selects.
Automated data preparation can help detect missing values, classify fields, standardise formats, and identify duplicates. However, automation does not remove the need for business ownership or quality standards.
Organisations should establish trusted sources, documented definitions, lineage, access rules, and quality checks before scaling AI-powered analytics. Teams should also understand how records are created, updated, and corrected within operational systems.
Training, validation, and production data require continuous monitoring. A model based on historical behaviour may become less useful when products, customers, markets, regulations, or internal processes change.
The strongest AI analytics projects begin with a dependable data foundation rather than treating AI as a shortcut around unresolved data problems.
When data quality is weak, the priority should be fixing the source, definition, or collection process—not adding a more complex model on top of the inconsistency.
Explainability, Validation, and Responsible Use
Explainability describes the ability to understand why an analytical system produced a particular result. Traditional calculations are often easier to trace because a user can inspect the formula, query, filter, or business rule directly.
AI explainability varies according to the model and use case. A simple regression model may be relatively easy to interpret, while a complex ensemble, neural network, or generative system may require additional explanation techniques and expert review.
Validation should confirm that the system performs appropriately on representative data and supports the intended business decision. Teams should test prediction quality, error patterns, stability, security, fairness, and performance under important business conditions.
Responsible use also requires honesty about uncertainty. A forecast is an estimate rather than a guarantee. A generated summary may omit context or misstate the evidence. Users should know when results require verification.
Important applications need escalation and fallback procedures. If a model produces an unusual output, the organisation should know whether to request human review, use a simpler analytical method, or stop the automated workflow.
The NIST AI RMF encourages structured governance and continuous risk management throughout the AI lifecycle. This reinforces the idea that validation is not a one-time activity.
Users should understand when an AI output can support a decision, when it requires review, and how to report an error or challenge the result.
Related Articles
Costs, Infrastructure, and Operational Trade-Offs
Traditional analytics and AI analytics create different cost structures. Conventional business intelligence generally requires data integration, storage, semantic modelling, report development, software licences, maintenance, and analyst time.
AI analytics includes many of the same foundations but may add model development, inference, experimentation, specialised infrastructure, validation, monitoring, security reviews, and advanced technical skills. Generative features can also introduce usage-based costs because every prompt or query may consume model and computing resources.
Cloud platforms can reduce the need to manage physical infrastructure. Serverless services allocate computing resources according to usage, but organisations still need to understand storage, processing, networking, model, and licensing charges.
Cost comparisons should therefore examine the complete analytical workflow rather than software price alone. A more expensive AI platform may reduce manual analysis, while a lower-cost model may generate poor results that require extensive correction.
Latency is another consideration. A scheduled financial report can tolerate a longer processing cycle, while fraud monitoring, operations management, or customer personalisation may require faster results.
Teams should measure cost per useful outcome, not simply cost per model call. Useful measures may include cost per forecast, completed analysis, resolved request, or automated decision.
Operational trade-offs also involve complexity. Each additional model, data pipeline, and integration creates maintenance requirements and potential points of failure.
The goal is not to minimise technology spending regardless of quality. It is to build an analytics capability whose cost, reliability, and business value remain sustainable over time.
Upfront and Ongoing Costs
Traditional analytics projects often begin with data integration, warehouse design, semantic modelling, dashboard development, access control, and user training. These investments can be substantial, but the operating model is usually predictable once the environment is established.
AI projects require many of the same foundations plus model development or configuration, labelled data, evaluation, deployment infrastructure, monitoring, and governance. Purchasing an AI-enabled platform may reduce custom engineering, but it does not eliminate configuration, validation, or change-management work.
Ongoing expenses may include inference, storage, data movement, retraining, model evaluation, security review, software licences, and specialist support. Natural-language interfaces can also create variable consumption because more employees may begin asking analytical questions.
Teams should establish budgets, quotas, monitoring, and access policies before broad deployment. High-value workflows may justify larger or more capable models, while routine tasks may use smaller models or traditional queries.
A pilot should compare the proposed AI workflow with the current baseline. Useful measures include analyst time saved, decision speed, prediction quality, adoption, correction effort, and operational impact.
Cost should always be interpreted in context. A system that appears inexpensive may become costly if it produces unreliable results, creates excessive review work, or requires frequent maintenance.
The objective is a sustainable improvement in analytical value, not the lowest possible technology bill.
| Business Requirement | Traditional Analytics Recommended | AI Analytics Recommended |
|---|---|---|
| Historical reporting | ✔️ | |
| KPI dashboards | ✔️ | |
| Regulatory compliance reporting | ✔️ | |
| Financial reporting | ✔️ | |
| Demand forecasting | ✔️ | |
| Customer churn prediction | ✔️ | |
| Fraud and anomaly detection | ✔️ | |
| Natural language data exploration | ✔️ | |
| Unstructured document analysis | ✔️ | |
| Real-time intelligent recommendations | ✔️ | |
| Routine business reporting | ✔️ | |
| Hybrid enterprise analytics strategy | ✔️ + AI | ✔️ + Traditional |
Complexity, Integration, and Maintenance
AI analytics introduces additional components that must work together. These may include data pipelines, warehouses, semantic models, feature transformations, model endpoints, prompts, vector indexes, monitoring systems, and business applications.
Every integration creates a potential failure point. A changed field name may break a model input, while a revised business definition may make a previously valid prediction misleading. Permissions or data availability can also change unexpectedly.
Traditional dashboards require maintenance too, but their logic is generally more visible and stable. AI systems may require retraining, recalibration, prompt updates, new evaluation cases, or additional monitoring as data and business conditions change.
Clear ownership is essential. Data engineering, analytics, data science, IT, security, and business teams may all contribute to one workflow. Without documented responsibilities, problems can remain unresolved because each team assumes another group owns the issue.
Standardised platforms can reduce integration work, but organisations should still plan for versioning, portability, access control, backup, rollback, and incident response.
The technical design should remain as simple as the use case permits. A recurring sales forecast may not need a complex generative architecture, while a document-analysis workflow may justify additional AI services.
Complexity should be introduced only where it produces measurable analytical or operational value. Every additional component must justify its cost, risk, and maintenance burden.
How to Choose and Implement the Right Analytics Approach
The correct analytical approach depends on the business question, available data, required speed, acceptable uncertainty, internal skills, and consequences of error.
Traditional analytics is often the right starting point for stable KPIs, recurring reports, financial summaries, compliance calculations, and audit-friendly analysis. These tasks benefit from documented formulas and repeatable outputs.
AI analytics becomes more useful when the organisation needs prediction, anomaly detection, automated classification, recommendations, natural-language access, or insight from unstructured information.
The decision should not be based on whether AI appears more advanced. Teams should compare each method with a measurable baseline and choose the simplest approach that meets the requirement.
A hybrid strategy is usually practical. Existing reports and dashboards continue to provide trusted performance metrics, while AI capabilities are introduced for carefully selected workflows where conventional analysis is slow, limited, or difficult to scale.
Implementation should begin with one narrow decision. Teams can then evaluate whether the AI model or interface improves quality, speed, productivity, or operational outcomes.
Governance must be included from the beginning. Data access, model limitations, user permissions, validation procedures, monitoring, and accountability should be defined before the system reaches a broad audience.
AI should expand the organisation’s analytical capability without weakening the consistency and transparency provided by established business intelligence.
A staged approach allows teams to build technical skills, business confidence, and governance processes before introducing AI into more consequential decisions.
A Step-by-Step Selection Framework
Use the following framework to select an appropriate analytics approach:
- Define the business decision. Identify the action or judgement the analysis must support.
- Clarify the analytical question. Determine whether you need explanation, prediction, recommendation, or automation.
- Assess the data. Review quality, history, structure, permissions, and representativeness.
- Establish a baseline. Measure the existing report, analyst process, rule, or statistical model.
- Choose the simplest suitable technique. Do not use AI where a transparent calculation or dashboard is sufficient.
- Pilot the workflow. Test the approach with limited users and realistic data.
- Evaluate business and technical outcomes. Measure quality, speed, cost, adoption, and error impact.
- Govern and monitor. Assign ownership, document limitations, and review performance continuously.
I recommend separating predictive recommendations from automated actions during the first pilot. Human users can review the output before the organisation gives the system operational authority.
Each stage should have clear acceptance criteria. A project should not move forward merely because a demonstration looks impressive.
The final decision should reflect measurable value, operational risk, user needs, and the organisation’s ability to maintain the system over time.
| Business Function | Traditional Analytics Approach | AI Analytics Enhancement | Expected Business Outcome |
|---|---|---|---|
| Sales | Monthly sales reports | Sales forecasting and lead scoring | Better revenue planning |
| Marketing | Campaign performance dashboards | Customer segmentation and campaign optimization | Higher marketing ROI |
| Customer Support | Ticket reports | AI-powered ticket classification and sentiment analysis | Faster response times |
| Finance | Budget and variance reports | Fraud detection and financial forecasting | Improved risk management |
| Operations | Operational KPI dashboards | Predictive maintenance and anomaly detection | Reduced downtime |
| Human Resources | Employee performance reports | Employee attrition prediction | Better workforce planning |
Building a Hybrid Analytics Roadmap
A hybrid analytics roadmap begins with reliable reporting and gradually introduces AI where it solves a clearly defined limitation.
The first stage is data readiness. Teams should align business definitions, improve data quality, document lineage, and apply appropriate access controls. These foundations support both traditional and AI-powered analysis.
The second stage introduces targeted predictive or classification models. Examples may include demand forecasting, customer-risk scoring, inventory prediction, anomaly detection, or support-ticket classification.
The third stage adds AI assistance for analysts and business users. Natural-language exploration, query generation, dashboard summaries, and automated visualisation can improve productivity when connected to governed data.
The final stage may integrate recommendations into operational workflows. At this point, approval rules, monitoring, audit trails, and fallback procedures become essential because the analytical output may influence real actions.
Each stage should have measurable success criteria. Features should not be expanded merely because users find them novel or impressive.
The roadmap should also preserve existing strengths. Trusted reports, stable metrics, and transparent calculations remain valuable after AI capabilities are introduced.
This gradual approach reduces risk while helping the organisation build technical knowledge, governance maturity, and user confidence.
A hybrid roadmap should be reviewed regularly as data, tools, regulations, user expectations, and business priorities change.
A practical AI analytics vs. traditional analytics guide also illustrates how businesses can gradually integrate AI into existing analytics workflows while maintaining governance and trusted reporting.
Quick Answer About AI Analytics vs. Traditional Analytics: Key Differences
Traditional analytics primarily uses reports, dashboards, queries, spreadsheets, and statistical techniques to explain what happened and why. Analysts normally define the business question, select the relevant data, apply known calculations, and present the results through a structured report or visualisation.
AI analytics adds machine learning, natural-language processing, pattern recognition, anomaly detection, and automation. These capabilities can help organisations predict future outcomes, classify information, generate recommendations, and analyse text, images, audio, or other unstructured data.
The main differences involve workflow, scalability, data types, speed, uncertainty, and the level of automation. Traditional methods provide greater control and reproducibility, while AI-powered methods can identify complex relationships and automate parts of the analytical process.
Neither approach is universally better. Traditional analytics remains essential for trusted reporting and governed metrics. AI analytics is most valuable when prediction, automation, large-scale pattern recognition, or natural-language access creates measurable business value.
What Does AI Analytics Mean?
AI analytics is the use of artificial intelligence techniques to support data preparation, exploration, prediction, classification, interpretation, and decision-making. It combines established analytics practices with capabilities such as machine learning, natural-language processing, data mining, computer vision, and generative AI.
An AI analytics system may forecast customer demand, estimate churn risk, identify unusual transactions, classify support messages, summarise documents, recommend actions, or answer questions through a conversational interface. The output may be a score, forecast, category, anomaly, recommendation, visualisation, or natural-language explanation.
AI analytics is broader than generative AI. A machine learning model can predict future revenue without generating text, while a generative system may explain the forecast or help an analyst create the query used to produce it.
Modern platforms often combine several approaches. BigQuery ML allows users to create machine learning models with SQL, while Copilot for Power BI provides natural-language assistance within a governed analytics environment.
The value does not come from adding AI to every report. It comes from applying an appropriate analytical technique to a clearly defined business question and connecting the result to a useful decision.
Is Traditional Analytics Outdated?
Traditional analytics is not outdated. It remains the foundation of financial reporting, KPI monitoring, regulatory analysis, operational dashboards, performance reviews, variance analysis, and many other recurring business processes.
These methods are particularly valuable when metric definitions must remain stable and results need to be reproduced. A monthly revenue report, for example, should use an agreed calculation and return the same result when the same data and filters are applied. A probabilistic AI interpretation would add unnecessary uncertainty to that task.
Traditional analytics also includes more than basic reporting. Analysts may use segmentation, statistical testing, optimisation, forecasting, and diagnostic techniques without relying on a generative AI interface.
The distinction between traditional and AI analytics is therefore not absolute. Predictive analytics has long combined historical data, statistics, and machine learning. Modern business intelligence platforms increasingly add AI assistance to established reporting workflows.
In practice, AI capabilities usually depend on a traditional analytics foundation. Trusted datasets, documented calculations, semantic models, dashboards, and SQL analysis provide the reliable business context that AI systems need.
Traditional analytics remains highly relevant whenever control, transparency, consistency, and auditability are more important than automated prediction or open-ended exploration.
Frequently Asked Questions About AI Analytics vs. Traditional Analytics: Key Differences
Questions about AI Analytics vs. Traditional Analytics: Key Differences usually focus on whether AI is more accurate, whether it can replace analysts, and whether established business intelligence methods remain useful.
The answers depend on the business objective. A recurring financial report has different requirements from a customer-churn model or document-classification workflow. Stable metrics benefit from transparent calculations, while uncertain future outcomes may require predictive modelling.
Data readiness also matters. AI analytics depends on representative data, reliable definitions, appropriate permissions, and ongoing monitoring. Organisations with fragmented or inconsistent data may achieve greater value by improving their analytics foundation before adopting advanced models.
The level of risk should influence the method. A low-impact AI assistant that suggests visualisations can operate with lighter controls than a model that influences customer eligibility, pricing, hiring, healthcare, or access decisions.
The following answers provide practical guidance rather than declaring one approach universally superior. Organisations should compare AI methods with an appropriate traditional baseline and measure whether they improve quality, speed, productivity, or business outcomes.
A mature strategy will normally combine dashboards, reports, statistical methods, machine learning, and natural-language interfaces. Each capability should be used where it is most appropriate.
The goal is not to replace every existing analytical process. It is to create a reliable environment in which people and systems can access the right type of insight for each decision.
Can AI Analytics Replace Traditional Analytics?
AI analytics should not replace every traditional method. Conventional reports, dashboards, SQL queries, spreadsheets, and transparent calculations remain essential for stable metrics and recurring business decisions.
Traditional analytics provides a reliable foundation for financial reporting, performance monitoring, regulatory analysis, and operational reviews. These use cases often require consistent definitions and reproducible results.
AI is most valuable when it adds prediction, automation, anomaly detection, natural-language access, or unstructured-data analysis to that trusted foundation.
Replacing a stable calculation with a probabilistic system may introduce unnecessary cost and uncertainty. For example, there is little benefit in using a generative model to calculate a metric that can be produced accurately with a documented SQL query.
The better strategy is usually integration rather than replacement. Traditional analytics establishes trusted facts, while AI helps organisations estimate future outcomes, identify complex patterns, or make analysis more accessible.
The choice should be based on the business question and consequences of error. Teams should use the simplest reliable method and introduce AI only where it produces a measurable improvement.
Is AI Analytics More Accurate?
AI analytics is not automatically more accurate than traditional methods. Performance depends on data quality, model selection, evaluation design, business context, and the specific question being answered.
A well-designed statistical model or carefully constructed business rule may outperform a poorly trained machine learning system. Similarly, a traditional report may be more dependable than a generated explanation when the metric definition is fixed.
AI becomes useful when relationships are too complex, numerous, or dynamic to represent efficiently through manual rules. Even then, the model must be tested against an appropriate baseline.
Accuracy should also be defined according to the use case. Forecast error, classification precision, recall, calibration, and business impact may all matter more than one general accuracy score.
Organisations should test models on representative data and examine where errors occur. A model that performs well on average may still fail for an important customer group, product category, or market condition.
Performance must be monitored after deployment because data and business behaviour can change.
AI analytics can improve analytical quality in suitable situations, but its results should never be assumed accurate merely because they were generated by an advanced model.
Does AI Analytics Require Data Scientists?
Some AI analytics projects require data scientists, machine learning engineers, or specialised analysts, particularly when teams are building custom models, preparing complex features, or integrating predictions into operational systems.
Modern platforms make selected capabilities more accessible. BigQuery ML allows users to create machine learning models with SQL, while natural-language interfaces can help business users explore governed data without writing every query manually.
However, easier access does not remove the need for expertise. Someone must define the business question, validate the data, evaluate the output, document limitations, and monitor performance.
Traditional analytics skills also remain important. SQL, statistics, data modelling, visualisation, and domain knowledge help teams determine whether the AI result is reasonable.
The required team depends on the complexity and consequence of the use case. A low-risk dashboard assistant may need less specialist support than a predictive model connected to an important customer or financial decision.
Organisations should avoid assuming that a user-friendly interface eliminates technical or governance responsibilities.
AI analytics may reduce the effort needed for some tasks, but reliable implementation still depends on a combination of data, technical, analytical, and business expertise.
Can AI Analyse Unstructured Data?
Yes. AI techniques can classify, summarise, extract, search, and analyse information from text, documents, images, audio, video, and other unstructured or multimodal formats.
This capability expands analytics beyond organised tables. Organisations can analyse customer reviews, support conversations, contracts, call transcripts, maintenance notes, photographs, and scanned documents.
Typical tasks include sentiment analysis, topic classification, entity extraction, document summarisation, transcription, image labelling, and content comparison.
However, unstructured data is often ambiguous. The same sentence may have different meanings depending on context, and documents may contain incomplete, outdated, or conflicting information.
AI-generated classifications and summaries should therefore be validated, especially when the output affects customers, compliance, legal processes, or operational decisions.
Privacy and access controls are also important because unstructured files frequently contain personal, confidential, or commercially sensitive information.
AI can make these sources more accessible, but it does not automatically make them accurate, complete, or suitable for every use.
The strongest implementations combine automated processing with quality checks, provenance, secure storage, and human review where the consequences justify it.
Will AI Replace Data Analysts?
AI is more likely to change analytical work than eliminate the need for data analysts. It can reduce repetitive tasks such as drafting queries, summarising dashboards, creating basic visualisations, or classifying large volumes of information.
Analysts will continue to define business questions, validate data, interpret results, manage metrics, and communicate recommendations. These responsibilities require organisational context and judgement that a model may not possess.
As AI handles more routine work, analysts may spend additional time reviewing assumptions, evaluating predictions, monitoring data quality, and connecting insights to operational decisions.
The role may also become more collaborative. Analysts may work more closely with data scientists, engineers, security teams, and business leaders to govern AI-enabled workflows.
Natural-language interfaces can allow more employees to explore data directly, but self-service access does not eliminate the need for governed definitions and expert support.
Analysts will be especially important when results are ambiguous, high-impact, or inconsistent with known business conditions.
AI can increase analyst productivity and expand the reach of analytics. The organisations that benefit most will use it to support professional judgement rather than treating automation as a complete replacement for analytical expertise.
What Is the Best First AI Analytics Use Case?
The best first use case is usually narrow, measurable, supported by sufficient data, and associated with manageable consequences.
Examples may include forecasting demand, classifying support messages, prioritising sales opportunities, detecting unusual operational behaviour, or summarising internal documents.
The use case should address a clear limitation in the existing workflow. AI may be appropriate when manual analysis is slow, difficult to scale, or unable to process unstructured information effectively.
Teams should establish a baseline before beginning. The AI approach can then be compared with the current report, rule, forecast, or analyst process.
A good pilot should have defined success measures such as time saved, prediction quality, reduced manual effort, faster response, or improved decision consistency.
It is also helpful to keep humans involved during the first stage. The model can provide recommendations while employees review the output and identify common failure patterns.
Avoid beginning with a broad goal such as “automate all analytics.” A focused project provides clearer evidence and limits risk.
Once the system demonstrates dependable value, the organisation can expand the capability to related workflows.
Conclusion
AI Analytics vs. Traditional Analytics: Key Differences is ultimately a comparison between complementary capabilities rather than a choice between modern and obsolete technology.
Traditional analytics provides stable reporting, transparent calculations, governed KPIs, and repeatable analysis. These qualities remain essential for financial, operational, regulatory, and performance-management decisions.
AI analytics extends this foundation through machine learning, natural-language processing, forecasting, automation, anomaly detection, and unstructured-data analysis. It can help organisations recognise patterns, predict outcomes, and make analytical tools more accessible.
These advantages create additional responsibilities. Teams must manage data quality, model validation, explainability, security, cost, permissions, and ongoing monitoring.
The best method begins with the decision being supported. A recurring metric may require a conventional dashboard, while a complex forecast may justify machine learning. A conversational interface can improve access, but it should connect to trusted semantic definitions.
For many organisations, the strongest solution will be hybrid. Traditional business intelligence establishes what is known, while AI helps users explore possibilities, anticipate outcomes, and act more quickly.
Adoption should occur gradually. Teams should begin with reliable data, a narrow use case, measurable success criteria, and appropriate human review.
AI analytics should enhance analytical maturity rather than bypass it. Organisations that combine established reporting disciplines with responsible AI methods are better positioned to produce insights that are fast, useful, explainable, and trustworthy.
Use AI Where It Adds Measurable Value
AI should be introduced where it improves an important outcome rather than simply because the capability is available.
A useful project may reduce forecast error, shorten analysis time, classify documents more efficiently, identify anomalies, or help employees explore governed data through natural language.
The proposed benefit should be compared with the existing process. If a traditional report already answers the question reliably and economically, replacing it may add complexity without producing meaningful value.
AI is more compelling when manual analysis cannot scale, relationships are difficult to represent through simple rules, or the organisation needs insight from unstructured information.
Teams should define success before implementation. Relevant measures may include prediction quality, decision speed, user adoption, analyst productivity, cost, operational impact, or correction effort.
Starting with a narrow use case makes evaluation easier and limits risk. The organisation can observe failure patterns and determine whether the capability is suitable for broader use.
AI features should earn expansion through evidence. A system should not receive additional users, data, or authority simply because the first demonstration appears impressive.
The objective is not maximum automation. It is a measurable improvement in analytical value, supported by appropriate governance and operational controls.
Build AI on a Trusted Analytics Foundation
A strong AI analytics programme begins with trusted data, agreed business definitions, secure access, documented ownership, and reproducible calculations.
Without these foundations, AI may provide faster answers without providing more reliable answers. Conflicting datasets and ambiguous metrics will continue to produce inconsistent results regardless of model capability.
Traditional analytics practices therefore remain central. Data modelling, quality checks, lineage, documentation, semantic definitions, and controlled access support both human analysts and AI systems.
Governance should increase with the consequence of the application. A low-risk assistant that suggests visualisations may require basic review, while a model that influences important customer or operational decisions needs stronger validation and monitoring.
Organisations should also define how users can question an output, report an error, and access a human reviewer.
AI should be treated as an extension of analytical maturity rather than a shortcut around it. The stronger the underlying data and reporting environment, the more useful advanced analytics is likely to become.
A trusted foundation also makes innovation faster because teams can develop and test new capabilities without repeatedly resolving the same data-definition problems.
